Case study / Selected work
DataEngine
Businesses don’t need more dashboards. They need answers.
A customer intelligence platform designed to connect marketing, sales, support, delivery and revenue data into one understandable view of the customer.
- Role
- Product Strategy · Data Architecture · Analytics UX · AI Systems
- Timeframe
- 2026
- Status
- Active Build
- Deliverables
- Concept, ingestion and dashboard UX, MVP scope and data model notes
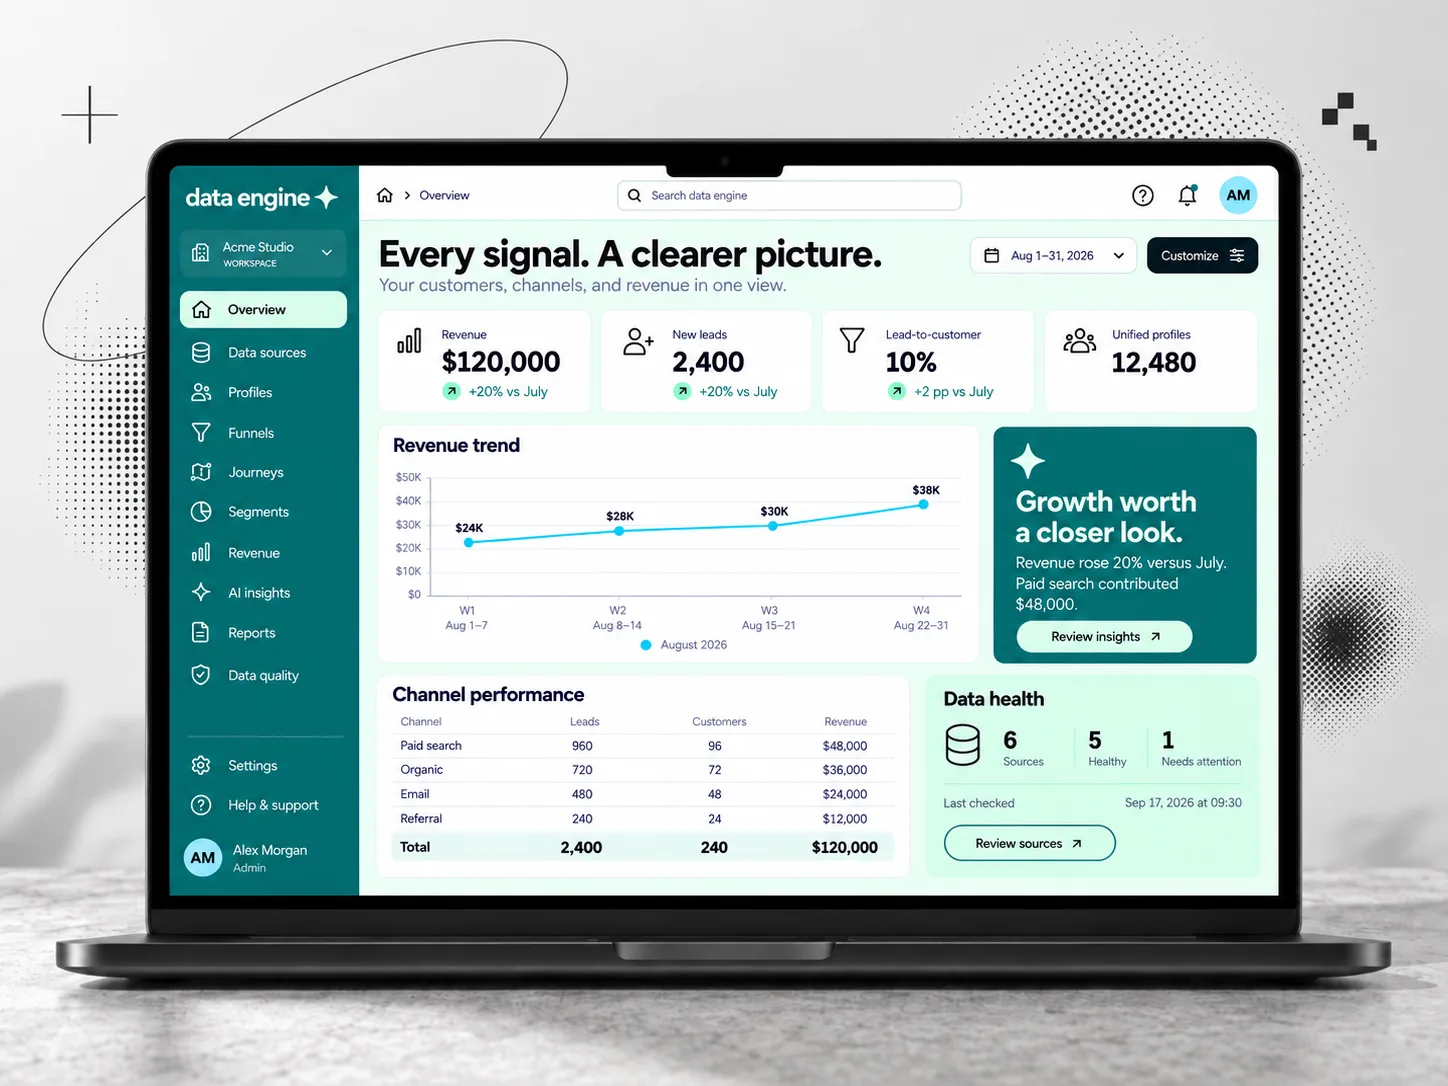
Data Engine is a customer intelligence and analytics platform designed to connect the fragments of customer information spread across a business.
Most companies already have customer data.
Marketing has campaign data.
Sales has CRM data.
Support has ticket data.
Operations has delivery data.
Finance has revenue data.
Product has usage data.
The problem is not absence of information.
The problem is that each department sees a different version of the customer.
Data Engine is designed to create the intelligence layer above those systems.
From data to customer understanding
The platform starts with a deceptively simple question:
What is actually happening with our customers?
Not just:
How many leads did we generate?
But:
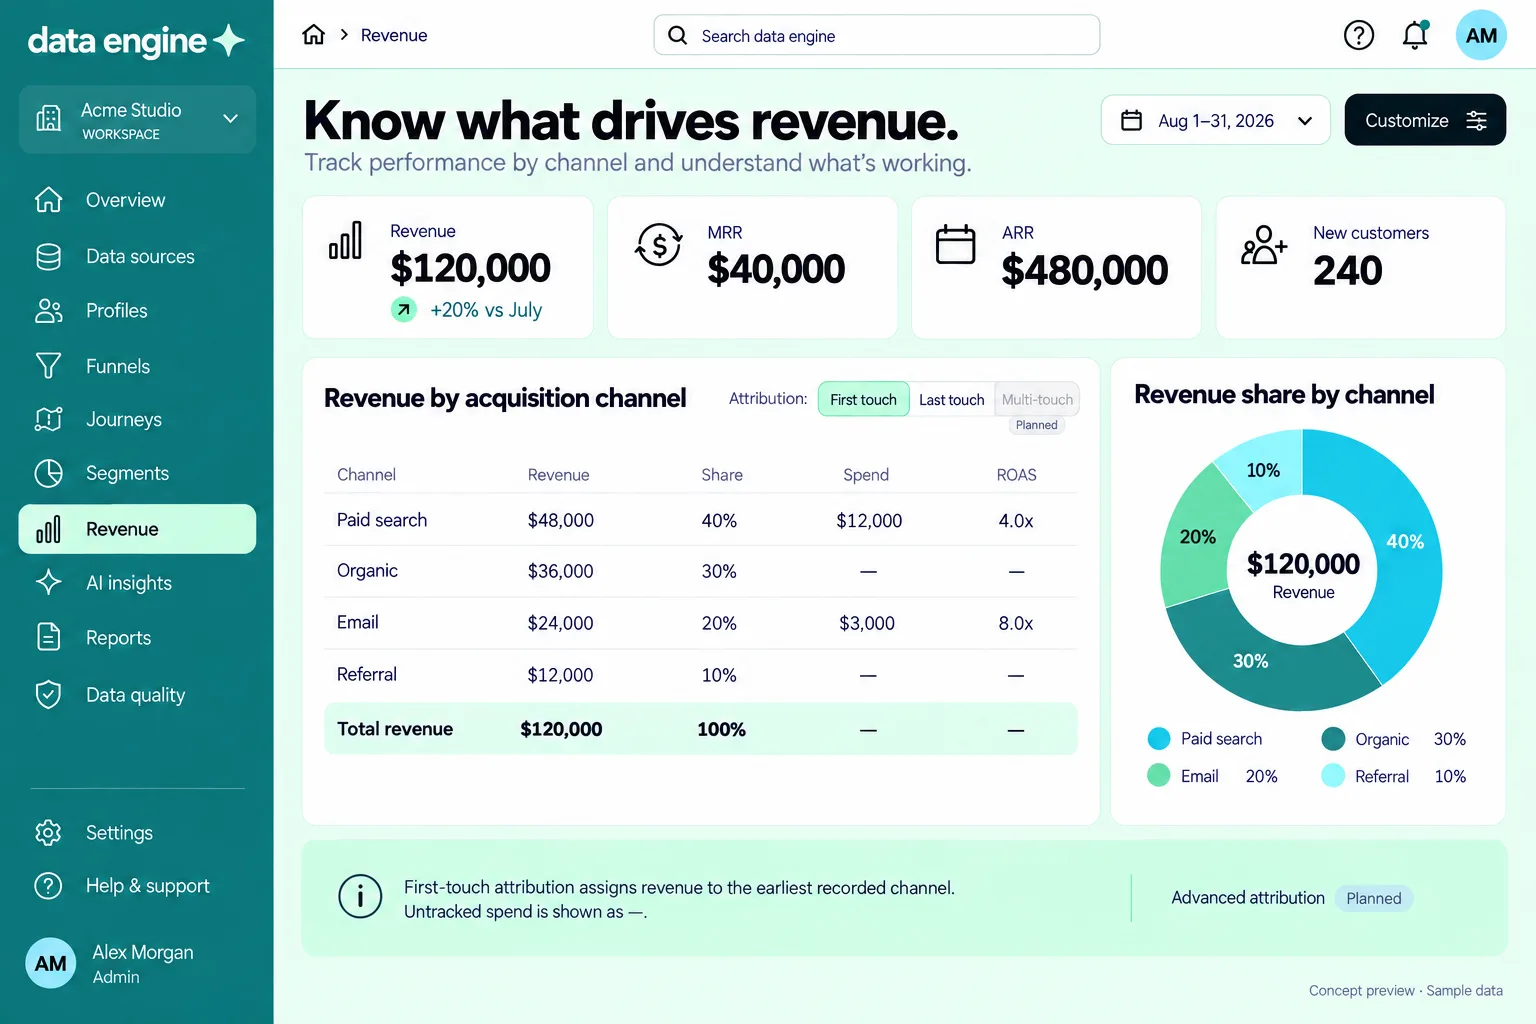
Which campaigns produced customers who actually bought?
Which customers require the most support after purchase?
Which acquisition channels create the highest-value relationships?
What behaviours tend to appear before churn?
Which customer groups are becoming more valuable?
Which customers are likely ready for another product?
Those questions require connecting the journey instead of analysing each department separately.
The customer graph
At the centre of Data Engine is a unified customer model.
Conceptually:
The difficult problem is not creating another dashboard.
It is identity resolution.
The system needs to understand that:
an email address captured through marketing,
a CRM contact,
a support conversation,
a completed project,
and a payment record
may all represent the same person or organisation.
Once those relationships are established, analytics can move beyond departmental silos.
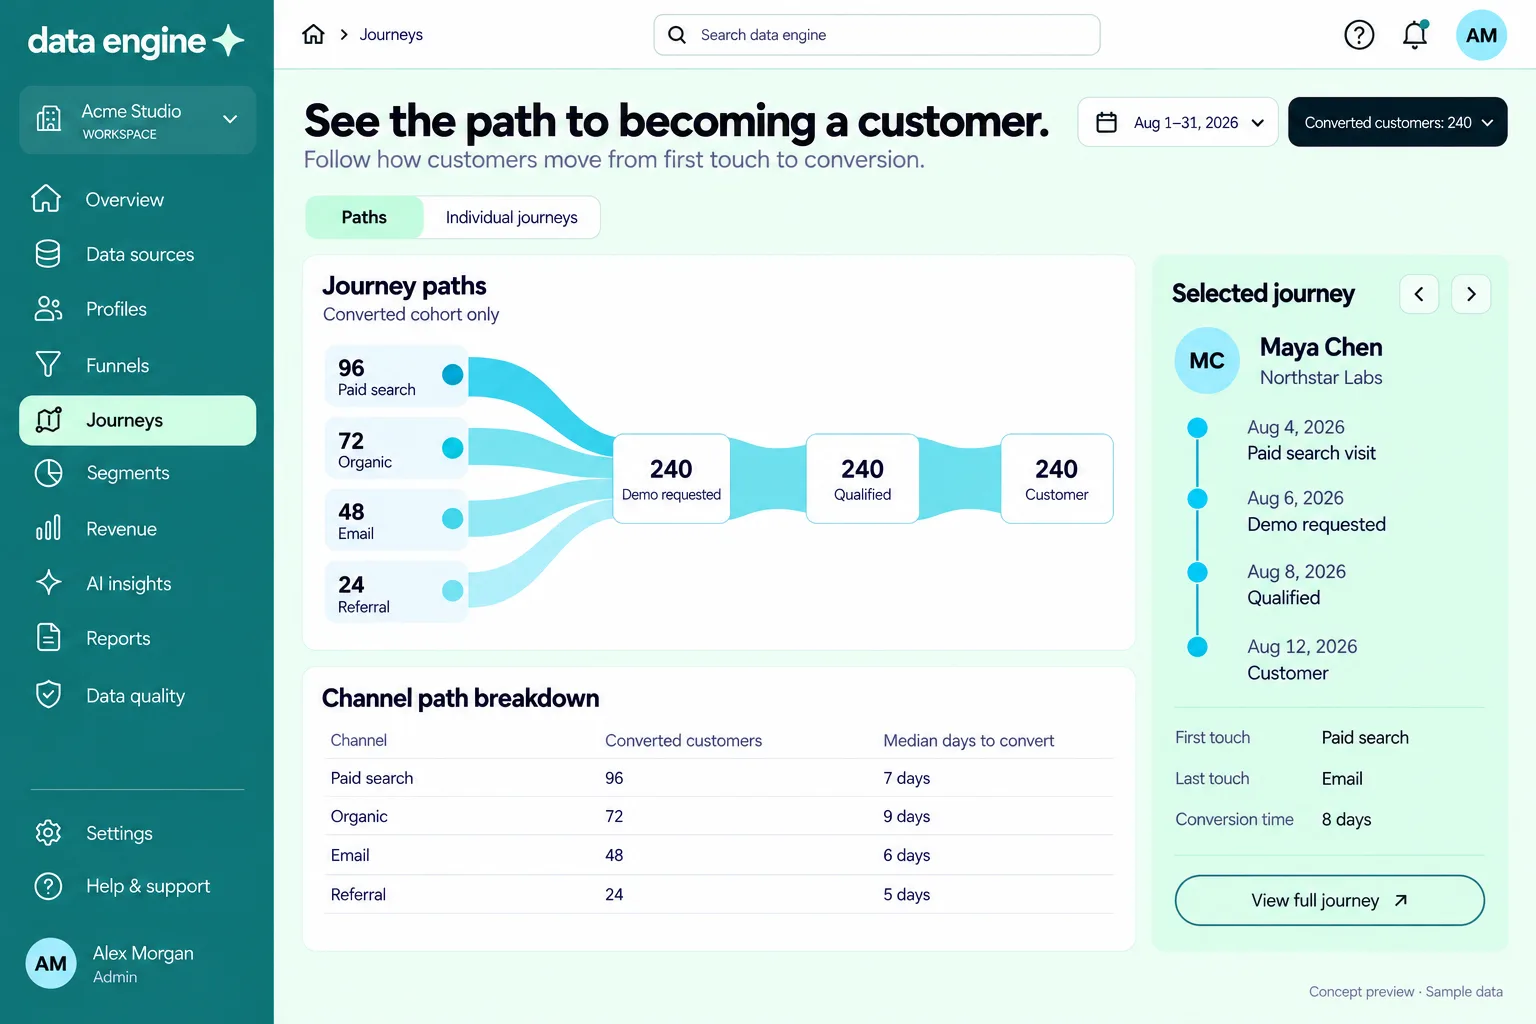
Customer 360
Instead of switching between several systems, teams gain one contextual understanding of the relationship.
- acquisition source
- campaign history
- sales journey
- revenue
- purchases
- projects
- support activity
- feedback
- health
- engagement
- retention
- lifetime value
Intelligence layer
But the interface should not require every user to become a data analyst.
- customer segmentation
- lifecycle analytics
- cohort analysis
- campaign attribution
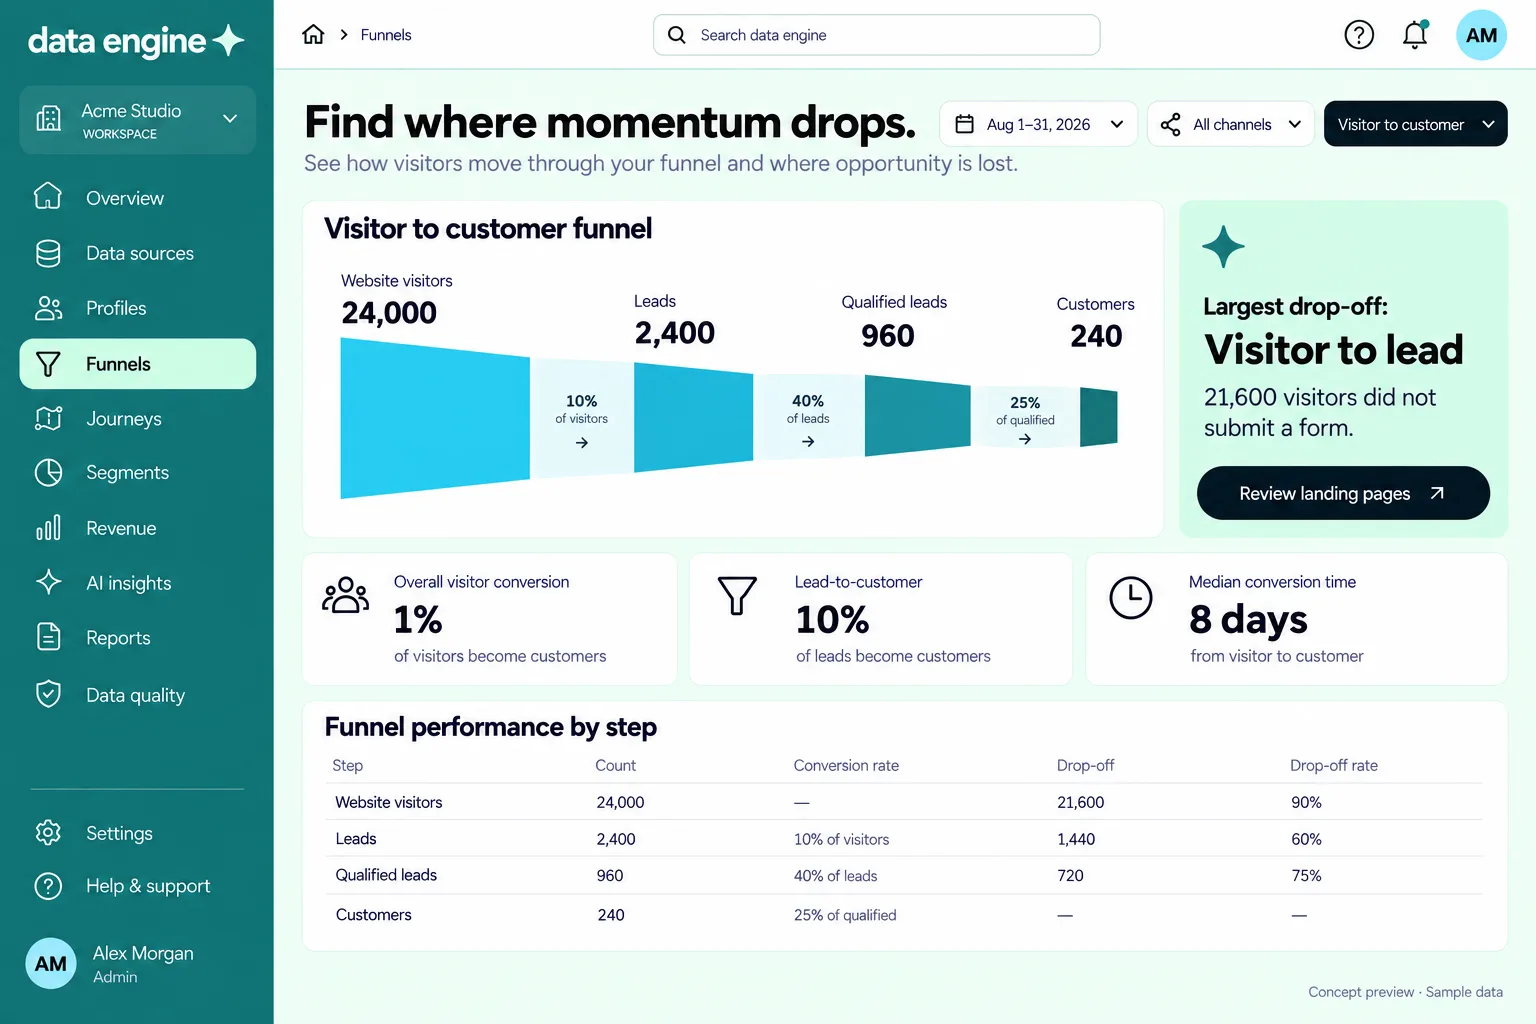
- conversion funnels
- customer lifetime value
- churn indicators
- retention analysis
- behavioural patterns
- customer health
- revenue intelligence
- support impact
- cross-sell opportunities
- anomalies
- acquisition quality
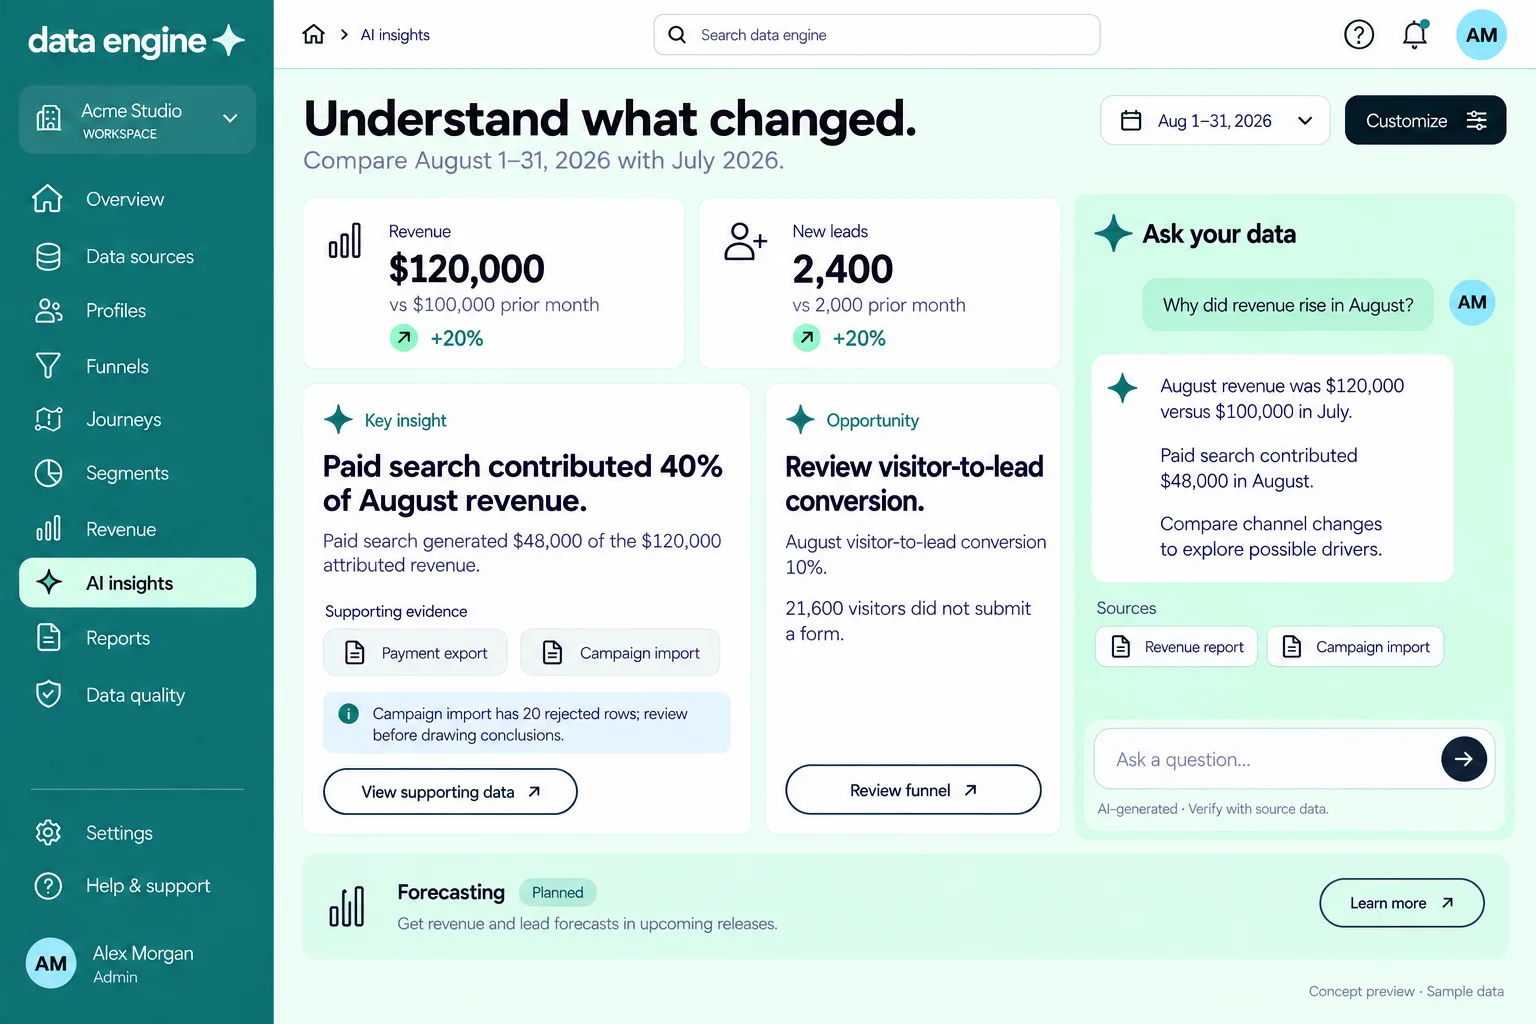
Ask the business question
Traditional analytics software often exposes the database structure to the user.
Choose dimension.
Choose metric.
Build chart.
Add filter.
Data Engine starts from another place:
What are you trying to understand?
A user might ask:
“Why did conversion fall this month?”
The system could then examine relevant dimensions and surface likely contributors.
Or:
“Which customer segment changed most this quarter?”
Or:
“Show customers with strong revenue but rapidly declining engagement.”
Or:
“What happened this week that deserves management attention?”
AI sits above the semantic and analytical layers to help users explore the business without needing to manually construct every query.
Analytics UX
Dashboards still matter.
But dashboards should answer known questions.
Exploration handles the unknown ones.
The UX therefore separates:
Monitor
from
Investigate
from
Explain
from
Act.
A metric changes.
The user opens it.
The system reveals the contributing segments.
The user explores a segment.
The system reveals relevant customers.
The user acts.
Analytics becomes a workflow instead of a wall of charts.
Architecture direction
Unlike a normal transactional SaaS application, Data Engine requires an analytical architecture centred around:
Event Ingestion · Connectors · Transformation Pipelines · Identity Resolution · Customer Profiles · Metric Definitions · Analytical Storage · Semantic Models · Aggregation · Scheduled Computation · AI Query Orchestration · Anomaly Detection
Operational products remain the source of truth for transactions.
Data Engine becomes the system that helps interpret what those transactions mean together.
What this project represents
Data Engine reflects my interest in the layer beyond software operations.
Once businesses have systems for marketing, selling, supporting and delivering, another problem appears:
How do you understand what all of those systems are collectively telling you?
The goal is not another place to look at graphs.
It is to move businesses from:
having customer data
to:
knowing what to do with it.
Tech stack
- Event Ingestion
- Connectors
- Transformation Pipelines
- Identity Resolution
- Customer Profiles
- Metric Definitions
- Analytical Storage
- Semantic Models
- Aggregation
- Scheduled Computation
- AI Query Orchestration
- Anomaly Detection
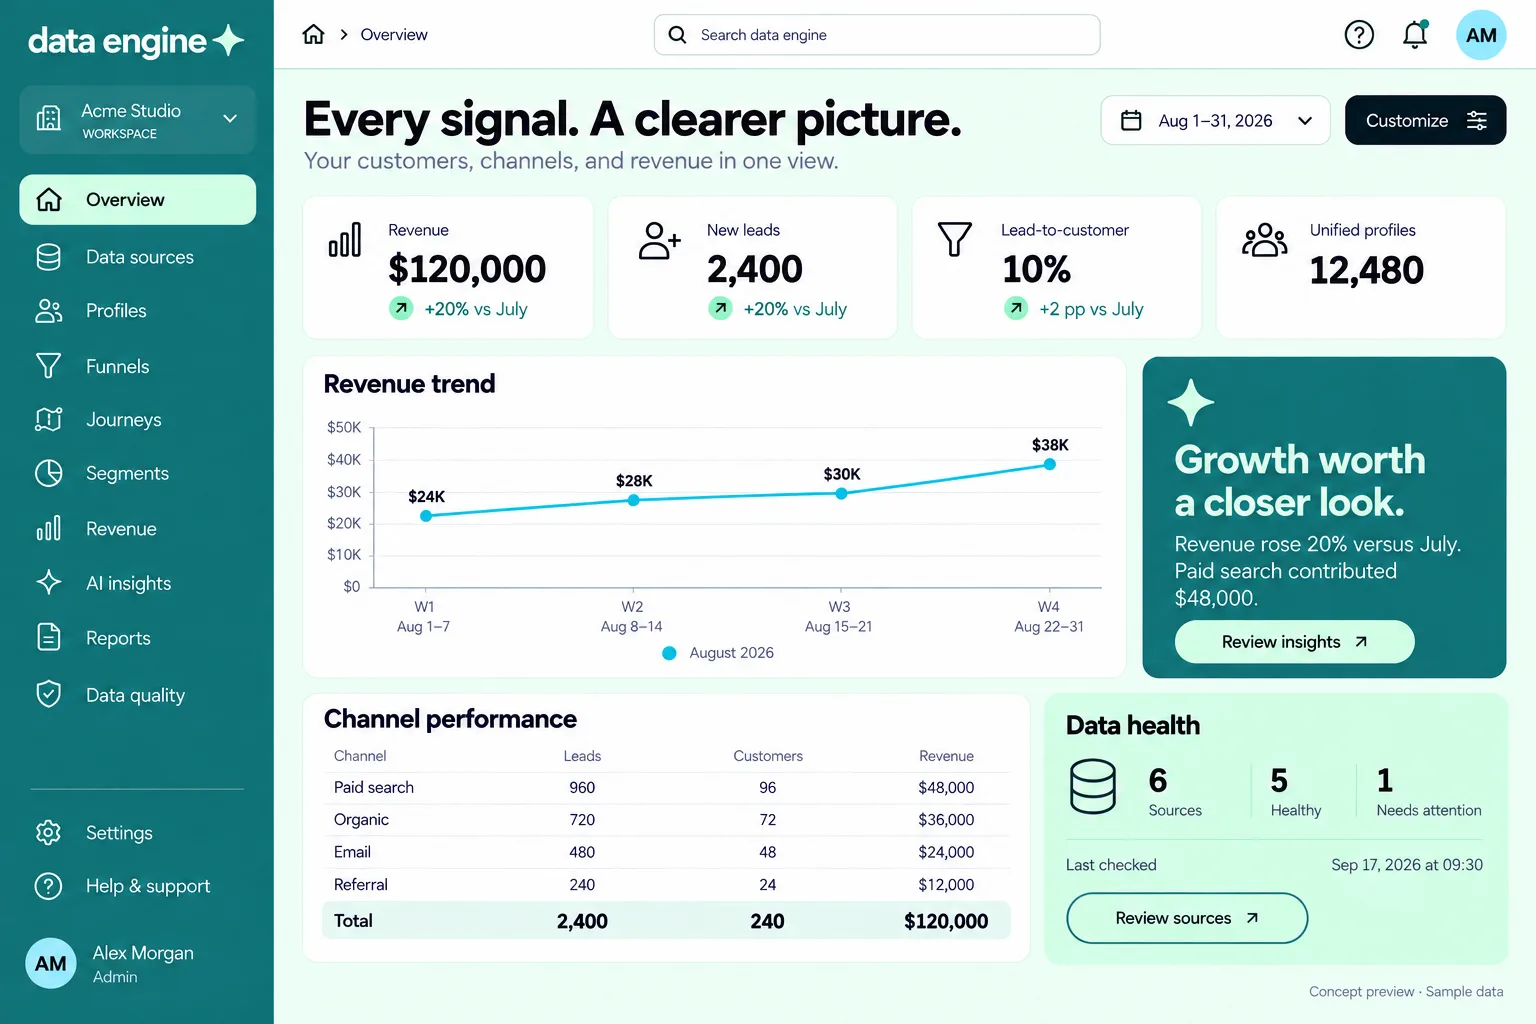
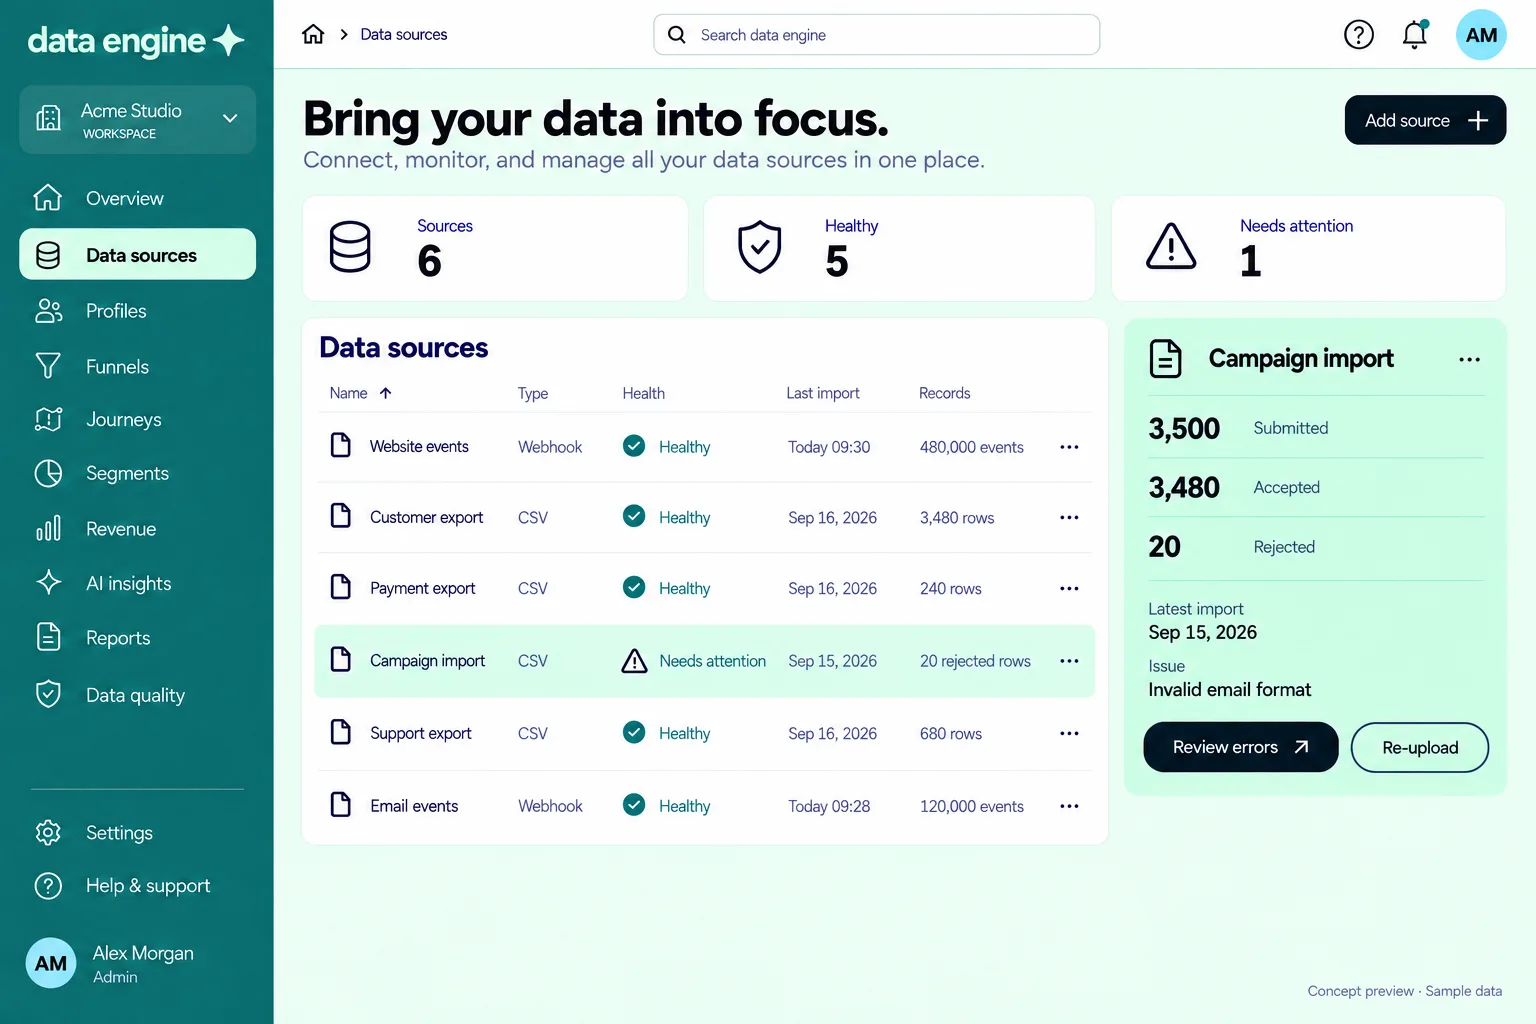
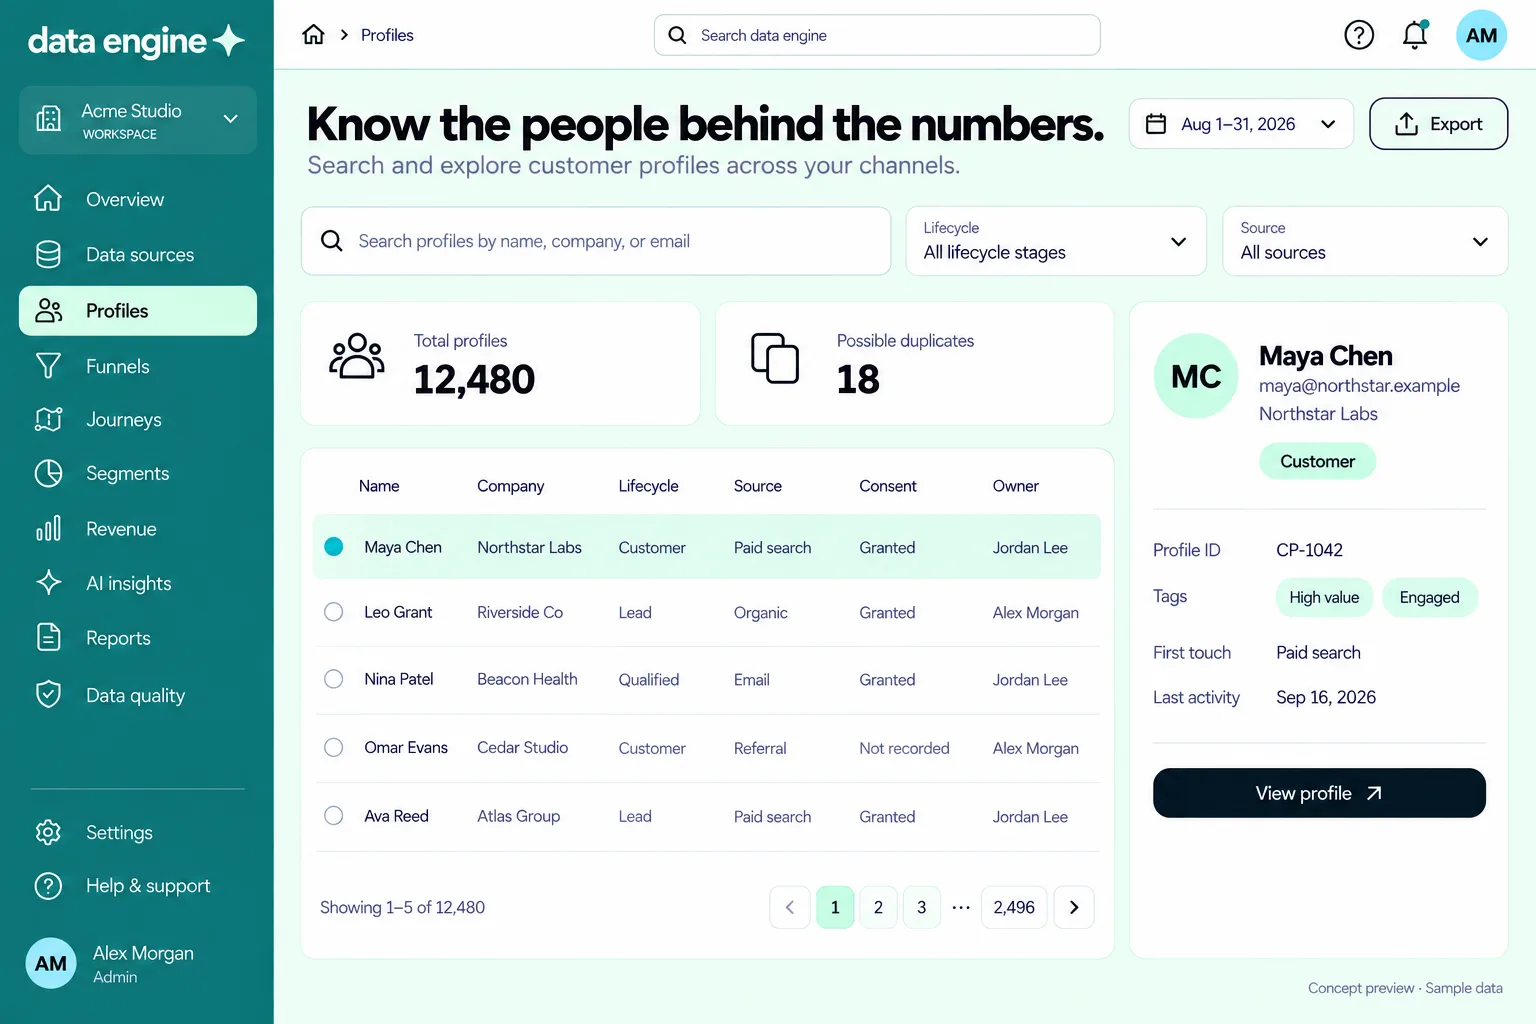
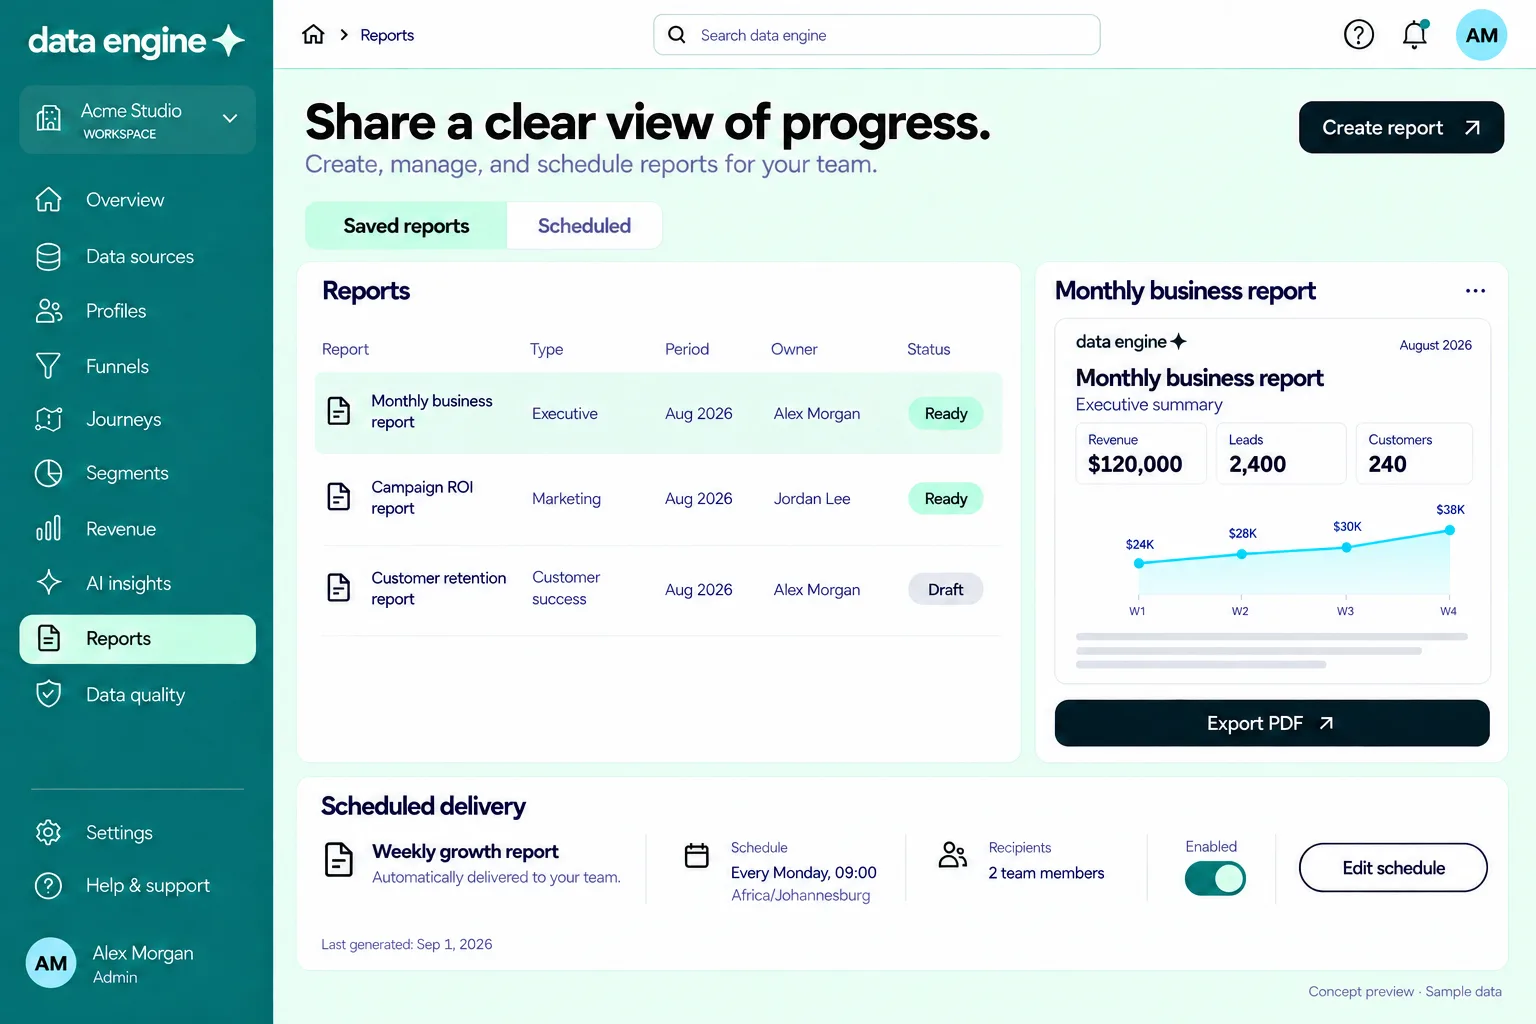
Inside the Product
Scroll sideways — or use the arrows — to walk through the product.
Product map
See how the seven systems connect.
Create → Market → Sell → Serve → Deliver → Understand — one thesis across seven products, plus the process behind all of them.